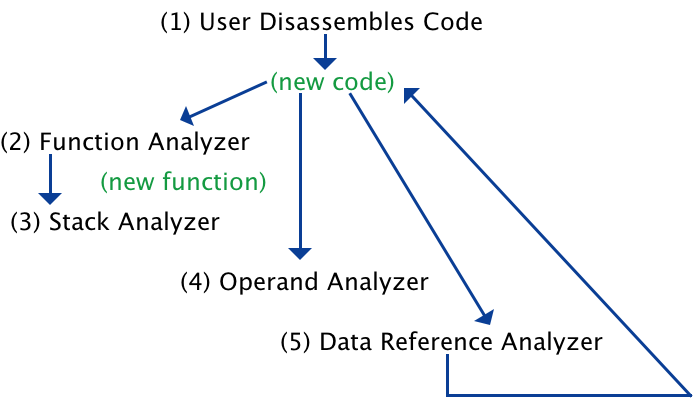
Auto Analysis watches for changes to the program, such as disassembling a new area of memory or definition of a function. When a change is noticed, it kicks off Auto Analyzer plugins interested in the change. Auto Analyzer plugins evaluate the changes and may decide to make further changes to the program. Any changes an Analyzer makes to the program may cause additional Analyzers to run. An example chain of auto analysis might be:
- The user triggers disassembly
- Function Analyzer - looks at all calls and creates Functions
- Stack Analyzer - looks at all new functions and builds a stack based on stack references
- Operand Analyzer - looks at scalar operands for possible address references
- Data Reference Analyzer - looks at references for possible strings or pointers to code. References to code are disassembled.
.....The cycle repeats with 2) as additional code is disassembled.One program change might cause several Analyzers to become active, however only one Analyzer is run at a time. Each Analyzer has a run priority. For instance, the Operand Analyzer will always run before the Data Reference Analyzer because the operand analyzer could create new references that the Data Reference Analyzer would need to analyze.
Auto Analyzers normally change the program only if the Analyzer can be certain the change is correct. For instance creating a function at the destination of a call is a fairly safe bet. Randomly looking for undefined data that could be disassembled where there are no actual code references would not be a good idea.
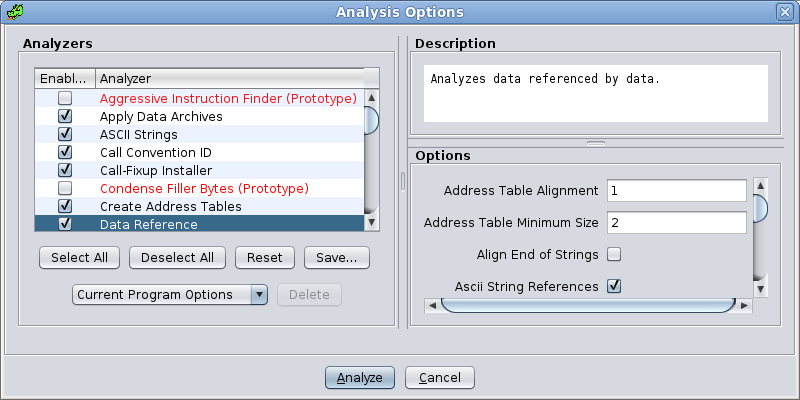
A program imported through Front End will have no initial analysis applied to it. To force analysis, use the Analysis
Auto Analysis menu item. The Auto Analysis Options dialog is displayed to allow changes to the analysis options before beginning analysis.
The display of this dialog may be controlled from the Auto Analysis Tool Options. Select the Auto Analysis node in the Edit
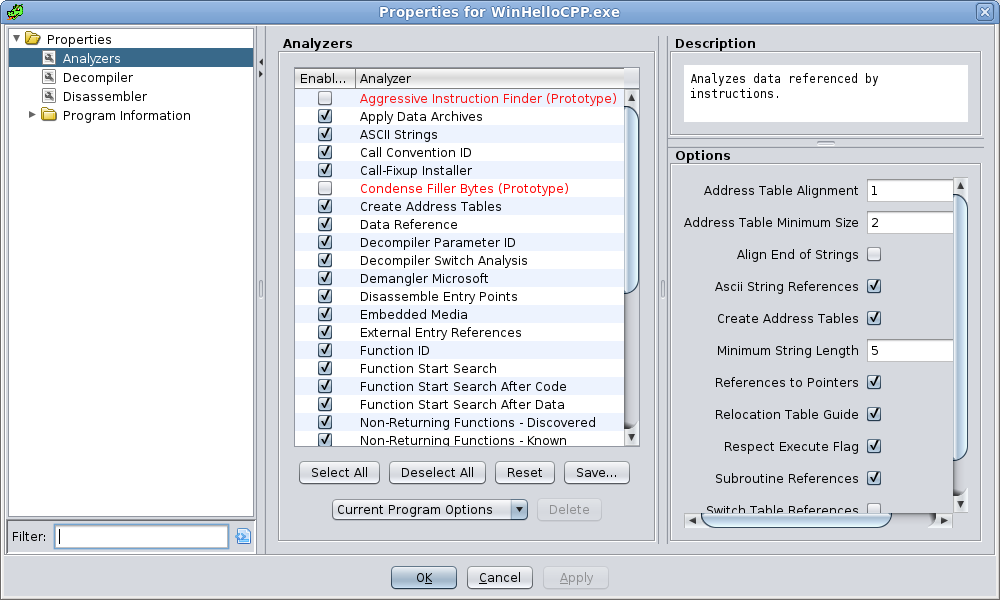
Any analyzer that is not in its default enablement state will show a yellowish color in the table of analyzer names.
Without a selection in the Code Browser, the entire program's memory space is analyzed. To restrict the analysis to certain areas of the program, select the area in the code browser before choosing Auto Analysis. If there is a current selection, Auto Analysis will be restricted to only to those areas of the program within the selection. Areas outside the selection may be changed by analysis. For example, if the OperandReferenceAnalyzer finds a reference within the selected area, a string or a function could be created at the referenced location.
When the Analyze button is pressed, the Options dialog will disappear. At the bottom of the Code Browser window, the background task bar will display. Any Analyzer activity status messages are within the task bar.
To Cancel the analysis, press the
button.
This action will auto-analyze all open programs. The options will be displayed only one time and re-used for each program.
When you choose options to use for analyzing a program, they are based upon the architecture of the current program. When analyzing all open programs, any programs besides the current program will only be analyzed if their architecture (language ID and compiler spec ID) match that of the current program. Any other open programs with an architecture differing from the current program will not be analyzed using this action.
Those specific analyzers which support on-demand analysis are available as One Shot Analyzers in the Analysis menu. Only those analyzers which support one-shot use and are applicable to the current program will be available within the One Shot sub-menu.
When opening a program for the first time, you will be asked if you want to analyze the program. If you respond "Yes", The Auto Analysis Options dialog will appear, allowing you to begin analyzing the program. If you decide not to analyze the program, you have the choice of having Ghidra asking you again the next time you open the program. If you pick the "No" options, Ghidra will continue to ask you to every time you open the program. If you pick "No (Don't ask again)" Ghidra will never ask you to analyze the program again, but you can still manually initiate analysis at any time. If you choose not to have Ghidra ask again, it will set a property in the program called "Should Ask To Analyze" to false. Since this changes a property in the program, the program now has changes that need to be saved.
Each Analyzer can be turned off using the Analysis panel in the Edit
The Analysis panel configures Analyzer specific options and which Analyzers are enabled to run. To view these options, choose Edit
Note that multi-user merge does not currently support merging of Program Options (including Analysis Options). Options stored in shared Program database following a conflicting checkin may not reflect option settings specified prior to checkin.
Saved Options Configurations
The Options Configurations combo box at bottom of the analyzer enablement panel can be used to quickly switch between sets of analyzer option values. The combo box will always contain two standard sets of options as well as any previously saved configurations. The two standard configurations are:
- Standard Defaults - This setting will put all the analyzer enablements and options to the original default values.
- Current Program Options - This setting will put all the analyzer enablements and options to values as stored in the current program.
Analysis Panel Buttons
- Select All - Turns all analyzers on.
- Deselect All - Turns all analyzers off.
- Reset - Resets all the options to the currently selected configuration.
- Save... - Saves the current analysis options to a named configuration.
- Delete - Deletes the currently selected named configuration.
The following is a description of the Auto Analyzers that have been implemented. Please note that this list may not be complete since additional Analyzers are continuously being added to Ghidra and can be supplied by add-on modules/contribs.
Address Table Analyzer
Looks at all undefined data locations to find possible address tables.
You can also find and create address tables manually via the Search for Address Tables
Started By: Importing or adding to a program, Auto Analyze command
ARM Analyzer
This analyzer works only against the ARM processor. It looks at multiple instructions to discover references that are put together by multiple instructions. Since the ARM is a RISC processor and each instruction is only 32 bits wide, many references must be created by multiple instructions.
Started By: New disassembled code
ASCII Strings Analyzer
This analyzer searches for valid ASCII strings and automatically creates them in the binary. Candidate strings are found using the same method (and most of the same associated options) as Search for Strings. Of the candidate strings found, valid strings are identified using a model trained on pre-identified valid strings. This analyzer runs at a very low priority.
Set options for this analyzer by selecting ASCII Strings on the options panel. Some options such as Require null termination for string and String start alignment work the same way as in Search for Strings.
Options
- Create Strings Containing Existing Strings - if checked, strings will be created even if they contain existing substrings (existing strings will be cleared). The string will be created only if existing strings (a) are wholly contained within the potential string, (b) do not share the same starting address as the potential string, (c) share the same ending address as the potential string, and (d) are the same datatype as the potential string to be created).
- Create Strings Containing References - if checked, strings that contain, but do not start with, one or more references will be created.
- Force Model Reload - if checked, forces the model to be reloaded every time the analyzer is run (in cases where the user wishes to see the effect of changing a model without restarting Ghidra).
- Minimum String Length - specifies the smallest number of characters in a string for it to be considered a valid string. For this analyzer, null termination characters are ignored for the purposes of counting characters. Note that smaller numbers will result in a larger number of false positives. String length must be at least 4.
- Model File - Specifies the model file built using the BuildStringModels class (default is 'StringModel.sng'). Note that the location of the model file does not need to be specified, as models should always be placed in the
<GHIDRA_INSTALL_DIR>/Ghidra/Features/Base/data/stringngrams/directory.- Require Null Termination for String - if checked, only null-terminated strings are created.
- Search Only in Accessible Memory Blocks - if checked, searches only in memory blocks that have at least one of the Read (R), Write (W), or Execute (X) permissions set to true. Enabling this option ensures strings are not created in areas such as non-loaded overlays or debug sections.
- String End Alignment - specifies the byte alignment requirement for the end of the string. An alignment of 1 means the string can end at any address. Alignments greater than 1 require that (a) the 'require null termination' option be enabled, and (b) if the null-terminated string does not end at an aligned boundary, that there exist enough trailing '0' bytes following the string to allow alignment. If neither (a) nor (b) apply, end alignment is not enforced.
- String Start Alignment - specifies the byte alignment requirement for the start of the string. An alignment of 1 means that strings can start at any address. An alignment of 2 means that strings must start on an even address. An alignment of 4 means that strings must start on an address that is a multiple of 4.
Started By: Auto Analyze command
Data Archive Analyzer
This analyzer looks at all the labels defined in the program and applies function signatures from standard data type libraries. For programs identified as "Microsoft Windows" executables, the data archive applied were parsed from the standard windows header files. All other executables will have function signatures applied from the standard "C" header files (stdio, fcntl, ...). For example, if a label exists for strcmp upon import, the analyzer will assume this is the standard C-library strcmp and apply a function signature of "int strcmp(char *, char *)".
Started By: Importing or adding to a program, Auto Analyze command
Data Reference Analyzer
Looks at all data references within newly disassembled code for Unicode/Ascii strings and functions. When a valid function is found, the code is disassembled starting at the referenced location. When a valid string is found, a string data type is created.
Enable this option by selecting Ascii String References, Unicode String References, or Subroutine References on the options panel for Instructions.
Started By: New disassembled code
Decompiler Parameter ID Analyzer
For each function created, run the decompiler and import the information recovered about the given function. The information includes:
- passed parameters
- local variables defined on the stack
- local variables defined in registers
- return value
- the prototype or calling convention (stdcall, cdecl, thiscall, fastcall, ...)
- switch tables recovered by data flow analysis
Applying type information recovered by the decompiler can be extremely useful if you have type information for library functions. You can apply function signatures to your library functions, and as code is disassembled, type information will be propogated from the library functions up into the parameters and local variables of the functions calling them.
Switch tables recovered by the decompiler can be applied to improve the disassembly of code. At times the basic switch table analysis cannot recover complex jump tables. The decompiler can also recover the value used to "switch" on for each case in the switch table. The label created at each switch case is created based on the recovered switch value.
This analyzer is being enhanced to pull more information gleaned from running the decompiler.
Enable this option by selecting Decompiler Parameter ID on the options panel for Functions.
Started By: Creating a function, or Re-Analyzing a program with functions already defined.
Demangler Analyzer
This analyzer examines the name of the newly created function. If the name appears to be a GCC v3 or Microsoft Visual Studio mangled symbol, then it will demangle the name and create a new primary symbol for the demangled name. It will also assign the appropriate datatypes to the parameters and return type.
The default demangler options are:
Name Description Apply Function Signatures Apply any recovered function signature type information in addition to the function name. Apply Function Calling Convention Apply any recovered function calling convention information. This option is ignored if the Apply Function Signatures option is false.Only Demangle Known Mangled Symbols Only demangle symbols that follow known compiler mangling patterns. Leaving this option off may cause non-mangled symbols to get demangled.
demangler_gnu_v2_24version of the demangler is a modified version of GNU'sc++filt (v2.24). The original version has known vulnerabilities, some of which have been mitigated in the version created for Ghidra. Use caution when enabling this feature.
ghidra.app.plugin.core.analysis.AbstractDemanglerAnalyzerto add your demangler analyzer callback. This allows you to precisely control which demanglers get called, as well as which options are used.
Started By: New defined functions
Disassembles code starting at all Symbols in the symbol table marked as External Entry Points.
Enable this option by selecting Disassemble Entry Points on the options panel for Byte.
Started By: Importing or adding to a program, Auto Analyze command
This analyzer detects variadic function calls in the bodies of each function that intersect the current selection. It then parses their format string arguments to infer the correct function call signatures. Currently, this analyzer only supports printf, scanf, and their variants (e.g., snprintf, fscanf). If the current selection is empty, it searches through every function within the binary. Once the signatures are inferred, they are overridden.
Started By: Importing or adding to a program, Auto Analyze command
This analyzer searches the program for images. If a valid image is found an appropriate image data type is applied at that location with the corresponding visual representation of the image. Also, a bookmark is added to indicate an image.
Started By: Importing or adding to a program, Auto Analyze command
This analyzer works only against the MIPS R4000 processor. It looks at multiple instructions to discover references that are put together by multiple instructions. Since the R4000 is a RISC processor and each instruction is only 32 bits wide, many references must be created by multiple instructions.
It will also look for certain types of switch or jump tables and automatically create a jump table.
Started By: New disassembled code
This analyzer works only against the PowerPC processor. It looks at multiple instructions to discover references that are put together by multiple instructions. Since the PowerPC is a RISC processor and each instruction is only 32 bits wide, many references must be created by multiple instructions.
It will also look for "bcctr" type switch statements and automatically create a switch table including references.
Started By: New disassembled code
This analyzer uses external Windows function call parameter information to populate comments next to pushed parameters. In some cases, data is labeled and commented as well
Started By: Auto Analyze command
Looks for scalar operands that are actually address references at each instruction operand within newly disassembled code.
Enable this option by selecting Scalar Operand References on the options panel for Instructions.
Started By: New disassembled code
Creates a stack frame (parameters and local variables) based on references to the stack found in newly defined functions.
Enable this option by selecting Stack References on the options panel for Function.
Started By: New defined functions
Creates a function at each destination of a call instruction. If the destination would create a complex function, the function is not created. A complex function is one with multiple entry points, or shared code with function.
Enable this option by selecting Create Functions on the options panel for Function.
Started By: New disassembled code
The Windows x86 PE Analyzers analyze a Windows PE program for MS Visual Studio data structures and code. They currently attempt to identify RTTI structures, virtual function tables, and exception handling code. One also analyzes the external functions and attempts to propagate the data types associated with the parameters.
These analyzers only run on PE programs.
Started By: Analyzing the program or creating instructions or defined data with a Windows x86 PE Analyzer analysis option selected.
The following is a description of the prototype Auto Analyzers that have been implemented.
Aggressive Instruction Finder
This analyzer runs at the lowest priority after there are no other analyzers needing to run. It looks at undefined bytes to see if code were disassembled at the start of an area it would form a valid subroutine. There can be no invalid instructions, and the subroutine must not "flow" into any existing code.
Needless to say this analyzer will not work well on every program, but on some it finds all code with no mistakes. Your mileage may vary. There's always undo...
Started By: Importing or adding to a program, Auto Analyze command
Condense Filler Bytes Analyzer
This analyzer searches the program for all specified filler bytes and collapses them. Some examples of filler bytes are: 0, 00, 90, cc. If you do not specify a certain byte pattern to search for then the default will be used. The default is the word Auto and it will allow the program to determine the best value to use based on the greatest count. You also have the option to change the minimum number of bytes to collapse. The default for this is 1.
Started By: Auto Analyze command
Provided by: AutoAnalysisPlugin