Ghidra supports multiple margin bars on the left side of the Listing that present various overviews for a program.
Each horizontal slice in the margin bar represents a relative address location in the program and is colored to indicate the property associated with that address or region in the program. The range of addresses represented in the margin bar is determined by the current view which by default is the entire address space of the program.
- Hovering the mouse on the margin bar will cause a tooltip to appear that gives you detailed information about the property and the address for that location.
- Left-clicking on the margin bar will navigate the listing to the associated address for the pixel that was clicked.
- Right-clicking on the margin bar will bring up a popup-menu which will at least include an option for displaying a legend for that particular overview.
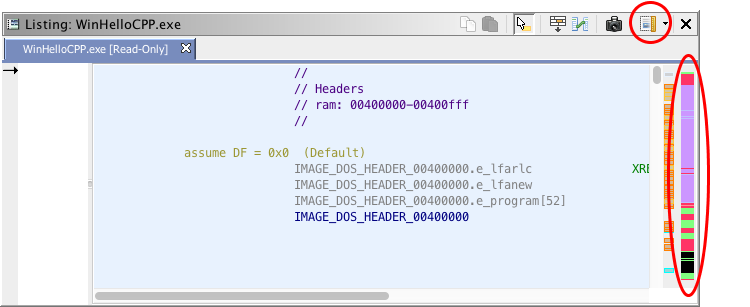
Overview margin bars can be turned on or off using the control button
on the Listing's toolbar.
The Address Type Overview Display shows a high-level view of the currently open program. Different colors are used to represent different types present in the program. For each address as determined by the vertical pixel location, the program is consulted for what is at that address.
The order of precedence for the coloring is as follows:
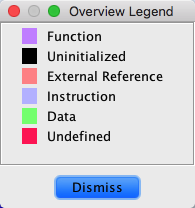
- Function - the address is within a function.
- External - the address has references to external locations.
- Instruction - there is an instruction at the address that is not currently defined to be in a function.
- Defined Data - a datatype has been applied to that address.
- Undefined Data - the address has an associated byte value, but no datatype has been applied.
- Uninitialized - None of the above. The address falls in an uninitialized memory block (no byte values)
Legend
The legend indicates the colors that correspond to each type of program element shown in the overview display. The colors used may be changed via the associated Options (see below).
Options
The Overview display has options that you can change through the Options dialog:
- Data Color - color for defined data
- External Reference Color - color for external references
- Function Color - color for functions
- Instruction Color - color instructions
- Undefined Color - color for undefined bytes
- Uninitialized Color - color for memory that is not initialized
To view the options, select Edit
Tool Options... on the tool, then choose the Overview node in the options tree. To change a color, double click on the color bar in the Overview Options panel. Choose the color from the color chooser dialog.
The entropy overview bar provides a byte based entropy statistic across the address set represented by the overview bar. The statistic can frequently distinguish between the encoding complexity of different types of data typically present in binary executables, such as machine code, ASCII, and compressed data. An overview of this entropy score can often provide an at-a-glance classification of the program into its major sections and sub-sections, without requiring the presence of an image format header.
Calculation of Entropy
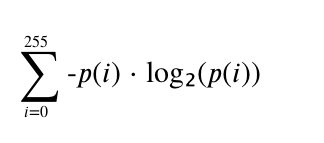
Entropy provides an estimate of the amount of variation in a set of data. For this plugin the data consists of the original bytes in the binary. Viewing the program as one long sequence of bytes, this sequence is split up into chunks with a default size of 1024 bytes per chunk. By calculating a histogram of all possible byte values, 0-255, we can easily calculate the probability, p(x), of any particular value, x, occurring in that chunk. The entropy of this probability distribution is defined as:
This gives a single value, between 0.0 and 8.0, describing the amount of variation in that single chunk. A score of 0.0 indicates that only a single byte value occurred throughout the entire chunk, so the chunk can be described as having no variation or no entropy. The score can vary continuously through 8.0, or full entropy, which indicates that every possible byte value occurs equally often within the chunk.
Data Encoding
Most data encoding schemes show a bias in favor of certain byte values at the expense of others. ASCII, for instance, encodes only byte values between 0 and 127, and if the ASCII is being used to encode (English) error messages in a binary, there will be a further bias for the ASCII ranges encoding alphanumeric characters. Entropy picks up on this bias, and for many schemes, a chunk of data encoded with it will exhibit an entropy value in a very restricted range. ASCII error messages usually fall in the range 4.2 - 5.2. The Entropy Plugin can color-code these ranges so that certain encodings stand out immediately in the overview window. Because entropy is statistical in nature, a specific chunk of encoded data may not have an entropy value that falls inside the typical range. But across an entire program, the bias for particular ranges will be readily apparent, and major sections will stand out clearly.
Entropy can easily distinguish between these common data encodings.
- x86 Machine Code: A specific instruction set like the Intel x86 has a very characteristic entropy range, which is well short of compression schemes, but packs more information per byte typically than ASCII. Different coding styles, compilers, etc. may have a consistent impact on the exact range of entropy values, but in general any block of machine code is easy to pick out.
- ARM/THUMB Machine Code: There are two machine code specifications for ARM chips: ARM instructions and THUMB instructions. These both have entropy ranges similar to x86 machine code, but the ranges for ARM vs THUMB are distinguishable. ARM instructions, which must use 4 bytes per instruction, are slightly more wasteful in their encoding than THUMB, and this stands out in their entropy range.
- ASCII: Entropy scores for ASCII encoded strings show its characteristic waste of the high bit in each byte and other biases for English letter frequency, null terminators, etc.
- Unicode: The wide character format typically used to encode Unicode characters is particularly wasteful, with every other byte encoded as 0 for typical English strings. This shows up as a characteristic range of low entropy values.
- Compression/Encryption: Data that has been compressed and/or encrypted typically shows very little bias at all in the byte values, and this corresponds to entropy scores very close to the maximum value of 8.0. Although entropy generally has little chance of distinguishing between different kinds of compression or encryption, this general category of encoding stands out quite clearly from other data typically found in a program.
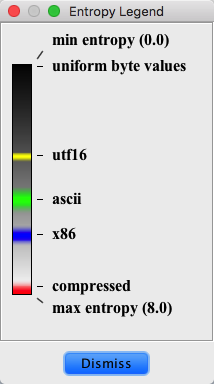
Color Palette Legend
Each color in the main bar encodes a specific entropy value, which can be determined by referring to the color palette which can be displayed by right-clicking on the bar and selecting the "show legend" action. The basic palette encodes entropy scores as a gradient, from black to white, for entropy scores from 0.0 to 8.0. In addition to this basic palette, the user can configure specific ranges to stand out with a specific color, which gets added into the base palette as a smaller color gradient. Multiple entropy ranges can be incorporated as distinct color gradients into the single palette. Each defined color range also has a label describing that range.
Configuring the Entropy Window
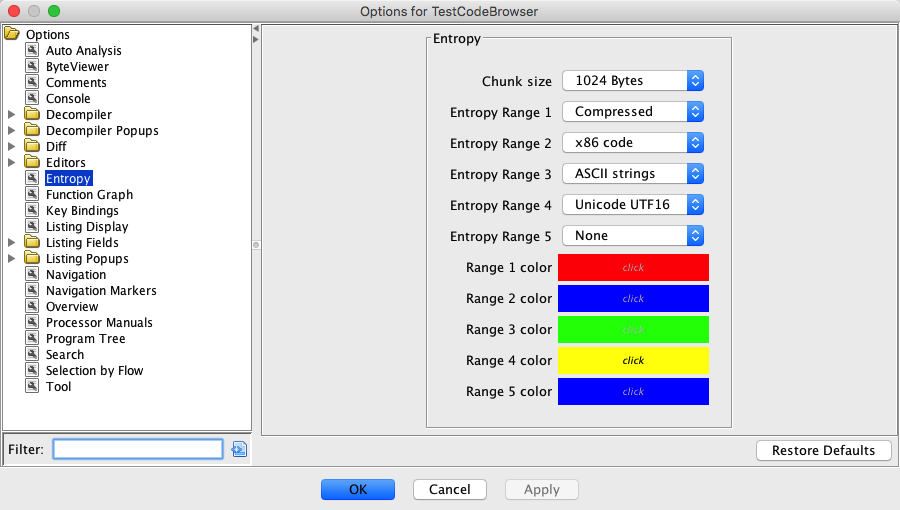
Select the Tool Options... entry of the Code Browser Edit menu, and then choose Entropy from the tree navigator at the left of the Options dialog. This allows the user to configure different ranges incorporated into the palette and the size of chunk used in calculating a single entropy score. The Entropy Plugin has the following options:
Chunk size
The chunk size can be set to a value of 1024, 512, or 256 bytes. This controls over how many bytes a single entropy score is calculated. To a small extent, the user can trade off the granularity of the Entropy window with how much variation to expect across an entire region of similarly encoded data.
Entropy Range #
The Entropy window color palette supports up to 5 different highlighted ranges. For each of the 5 slots, this option presents a drop menu of common entropy ranges that can be selected. These include: x86 code, ARM code, THUMB code, PowerPC code, ASCII strings, Compressed, and Unicode UTF16. Slots that are unused can be set to None.
Range # color
The color that is used to highlight a specific range can be set with this option. Entropy values that hit the exact middle of the range will get assigned to the chosen color, and a steep gradient, connecting this color with the bounding colors within the base palette, will be used to fill out the color range.
Provided By: OverviewPlugin