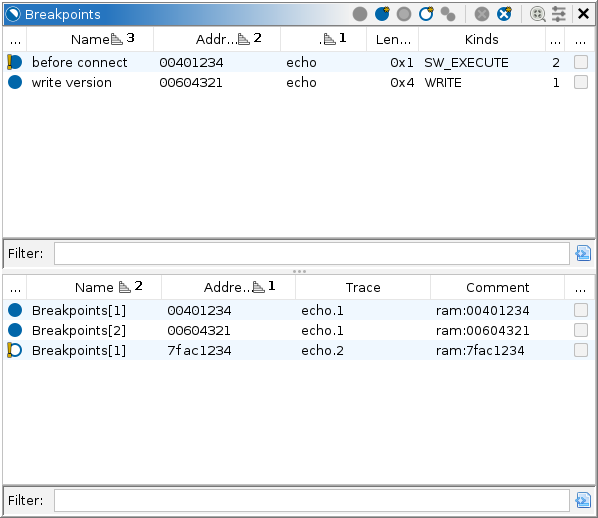

The breakpoints window tabulates and manipulates breakpoints among all traces, including live targets. Only address-based breakpoints are tabulated. For other traps, e.g., "break on exception," see the Model window. Breakpoints can also be manipulated from address-based views, especially the disassembly listings. See Breakpoints in the Listings.
Individual breakpoint locations from among the traces are consolidated into logical breakpoints, based on their addresses in the static listing. The current breakpoint set comprises the static locations, stored as bookmarks in their respective program databases. See the Static Mappings window for the finer details of address mapping. A breakpoint which cannot be mapped to a static address becomes its own logical breakpoint at its dynamic address. The top table of the provider displays logical breakpoints; the bottom table displays individual breakpoint locations. NOTE: Only those breakpoints visible at the current snapshot of each trace are included. For live targets, this is typically the latest snapshot, i.e., the present.
Depending on what is supported by the connected debugger, breakpoints can trap a target when an address or range is executed, read, or written; using software or hardware mechanisms. In the case of read or write breakpoints, debuggers may differ in terminology. For example, GDB might call them watchpoints, but Ghidra still calls these breakpoints. Some debuggers allow the user to specify a breakpoint location other than by address, but ultimately each specification is realized by 0 or more addressable locations. To accommodate this, the Model window will typically display a list of specifications, each listing its locations as children. However, the grouping of breakpoint locations into logical breakpoints by Ghidra's breakpoint manager is done without respect to the debugger's specifications. A specification may be at a higher stratum than Ghidra natively understands, e.g., the source filename and line number, and so such specifications are not relevant. Also note that the debugger might not permit locations to be toggled independently of their specifications. This may limit how Ghidra can operate, since in that case, it must toggle the specification, which may affect more locations than intended.
When the control mode is set to Trace or Emulator, it is possible to rewind the trace to past snapshots and examine old breakpoints. You may also emulate from those snapshots, even if the target is no longer alive. By default, those historical breakpoints are disabled in the integrated emulator, but they can be toggled in the usual ways. In addition, the locations can be manipulated independently, since the emulator has its own breakpoint set. Emulated breakpoints can be configured with conditions expressed in Sleigh using the Set Condition action, or configured to replace the instruction's semantics altogether using the Set Injection action.
Because of the logical grouping of breakpoints, it is possible for a breakpoint to be in a
mixed or inconsistent state. This happens quite commonly, e.g., when a breakpoint is placed in
the Static Listing before that program is mapped to any trace. Once mapped, the dynamic
location of that breakpoint is computed and noted as missing. A logical breakpoint without any
location in a target is called ineffective and is drawn in grey, e.g.: . An enabled logical breakpoint
having a disabled location is called inconsistent and its icon will include an
exclamation mark:
. A disabled
logical breakpoint having an enabled location is similarly inconsistent. Toggling an
ineffective or inconsistent logical breakpoint enables and/or places all its mapped locations,
aiming for a consistent enabled state. Toggling it again disables all locations.
The top table, which lists logical breakpoints, has the following columns:
The bottom table, which lists breakpoint locations, has the following columns:
The primary purpose of this provider is to manipulate existing breakpoints. It provides the following actions to that end. Breakpoints can also be managed via the Breakpoint Marker Actions in the listings.
This is a dropdown of actions provided by the back-end debugger, usually for setting breakpoints by symbol, expression, etc. Setting breakpoints by address is typically done from the Listings. If no such actions are available, or there is no live target, this action is disabled.
This action is available when one or more breakpoints or locations are selected. It enables each selected breakpoint. For any breakpoint that is already enabled, no action is taken.
This action is always available. It enables every breakpoint. For any breakpoint that is already enabled, no action is taken.
This action is available when one or more breakpoints or locations are selected. It disables each selected breakpoint. For any breakpoint that is already disabled, no action is taken.
This action is always available. It disables every breakpoint. For any breakpoint that is already disabled, no action is taken.
This action is available whenever there are mapped breakpoints with 0 locations, i.e., it corresponds to a target location where the breakpoint is still missing. It places such breakpoints where possible. This action is also offered as a resolution in the console. It appears in the log any time this action is available.
This action is available when one or more breakpoints or locations are selected. It clears (deletes) each selected breakpoint.
This action is always available. Use with caution! It deletes every breakpoint.
This action is available when all selected locations are emulated execution breakpoints.
(Conditional access breakpoints are not yet implemented.) It sets the condition using a Sleigh
expression that when true will trap the emulator. When false, the emulator continues past the
breakpoint without interruption. Sleigh operates similarly to C: zero is considered false,
while everything else is considered true. The dialog provides syntax checking, but does not
verify the semantics. If the breakpoint condition is not semantically correct, then the
breakpoint behaves as if unconditional; it will interrupt the emulator then indicate the
semantic error. To trap unconditionally (the default) use 1:1. Otherwise, use a
boolean Sleigh expression, such as RAX >= 0x1000. Sleigh conditions are rather
expressive. For example, on an x86 target, you might place a breakpoint at the entry of a
function and set the condition to (*:8 RSP) & 0xfff00000 == 0x00400000. This
will break on calls to the function from any address matching 0x004?????.
This action is available when all selected locations are emulated execution breakpoints.
(Injections on access breakpoints are not yet implemented.) It replaces the instruction's usual
Sleigh semantics with those entered into the dialog. The Sleigh syntax is the same as used in
the processor language's Sleigh specification (.slaspec and .sinc
files). The dialog provides syntax checking, but does not verify the semantics. If the
injection is not semantically correct, then the breakpoint behaves as if unconditional; it will
interrupt the emulator then indicate the semantic error. NOTE: The semantics at the
breakpoint address are completely replaced, ignoring the original instruction
entirely. This includes its control flow behavior, even fall through. The replacement semantics
must provide control flow behavior, or else the emulator's program counter will not
advance, and the same injection will be executed repeatedly. Here are three ways to provide
control flow:
emu_exec_decoded() userop: This is probably the most common method,
and is usually the last Sleigh statement in the injected semantics. This userop, which is
defined by the emulator, instructs it to decode and execute the instruction at the program
counter, effectively incorporating the original instruction's semantics. If this is not the
last statement of the injection, please consider: If the instruction transfers control, the
remainder of the injection is not executed. If the instruction falls through, the
remainder of the injection is executed.emu_skip_decoded() userop: This is a less common method, and is
usually the last Sleigh statement in the injected semantics. This userop, which is defined by
the emulator, instructs it to decode but skip the instruction at the program counter.
(Decoding is necessary to determine the instruction's length.) Use this when the intent is to
replace the original instruction's semantics. This will ensure the program counter advances
without actually executing the original instruction. No matter the original instruction's
control flow, this imposes fall through. It may be used to skip over function calls or
jumps.call, goto, and return.
Note that just as in processor specifications, a control transfer statement will be the last
statement executed for the injection. It immediately sets the program counter, skipping the
remainder of the injection.Here are a few examples:
emu_swi() "emulator software interrupt" userop, which is defined by the
emulator. The second statement incorporates the semantics of the original instruction:
emu_swi();
emu_exec_decoded();
RAX >= 0x1000. This is a simple extension of
the unconditional breakpoint. The emu_swi() call is skipped if the inverse of
the condition is true:
if RAX < 0x1000 goto <L1>;
  emu_swi();
<L1>
emu_exec_decoded();
x86:LE:64:default:gcc. The injection, located at the function's entry or in
the program linkage table, would place the return value into the expected storage location
then replicate the behavior of RET:
RAX = 0;
RIP = *:8 RSP;
RSP = RSP + 8;
return [RIP];
JZ to be taken, without modifying the image. This depends on the
architecture. Take x86 for example. The injection, located on the conditional jump, would
simply set the flag accordingly then execute the original instruction:
ZF = 1;
emu_exec_decoded();
Alternatively, suppose the example instruction is
JZ 0x00401234. Then, the
injection can jump straight to the target:
goto [0x00401234];
JZ to fall through, without modifying the image. The injection,
located on the conditional jump, would simply skip the instruction:
emu_skip_decoded();
For organizing breakpoints the manager provides the following actions:
This toggle is always available. It filters the bottom table to those locations in the current trace only. Additionally, the "Locations" column of the top table will only count those in the current trace.
This action is always available. It filters the bottom table to those locations belonging to a selected breakpoint in the top table.