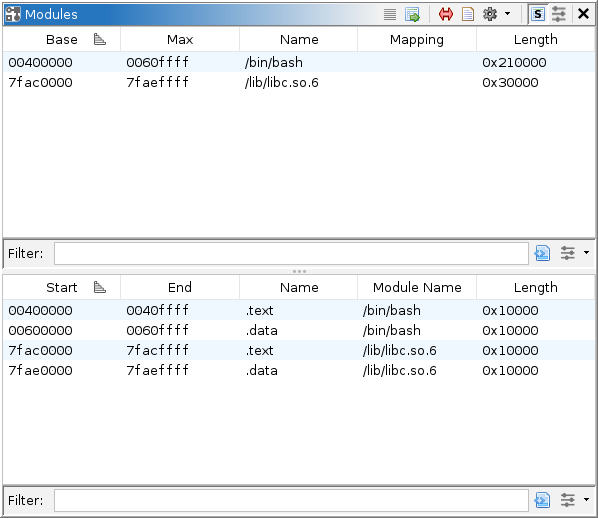

The concept of a module may vary from platform to platform, but in most cases, it refers to a binary image which is loaded or mapped into memory comprising some portion of the target's executable code. Likely, these are the same files that Ghidra can import for static analysis. Similarly, the concept of a section may vary, but in most cases, it refers to a portion of a module, possibly backed by its binary image. This window displays information about modules, and sometimes their sections, known to the back-end debugger. Information in this window reflects what has been recorded into the current trace, which in turn comes from a target. The top table displays module information, while the bottom table displays section information.
The top table, which lists modules, has the following columns:
The bottom table, which lists sections, has the following columns:
This window provides several actions, some of which are only accessible via pop-up menus.
This action is available from a module's or section's pop-up menu. It prompts the user to import the module from the local file system into Ghidra as a static image.
This action is always available. It automatically maps trace memory to static images, using Module, Section, or Region information. See the Map Modules, Map Sections, and Map Regions actions for more information. When enabled, this action will automatically perform the corresponding action whenever the relevant table is updated. By default, it automatically maps using Modules.
This action is available when both a trace and a program are opened. It maps the current trace to the current program using identical addresses. This action ignores the module list. It is a suitable mapping when the current program is loaded in the trace without relocation. It is also a fallback worth trying in the absence of a module list.
This action is always available. It simply displays the Static Mappings window. From there, it is possible to construct the map from trace memory to static images entirely by hand.
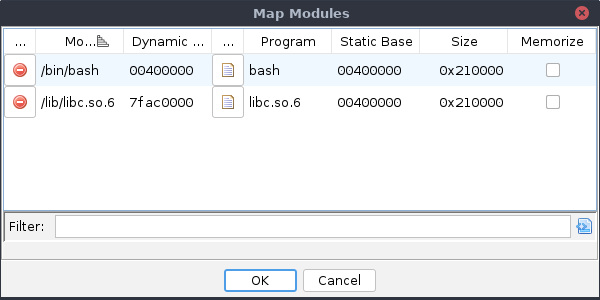
This action is available from the modules' or sections' pop-up menu. It searches the tool's open programs for the selected modules and proposes new mappings. The user can examine and tweak the proposal before confirming or canceling it. Typically, this is done automatically by the Auto-Map action. By selecting "Memorize" and confirming the dialog, the user can cause the mapper to re-use the memorized mapping in future sessions. The memorized module name is saved to the program database.

This action is available from a single module's pop-up menu, when there is an open program. It behaves like Map Modules, except that it will propose the selected module be mapped to the current program. This action with the "Memorize" toggle is a good way to override or specify a module mapping once and for all.
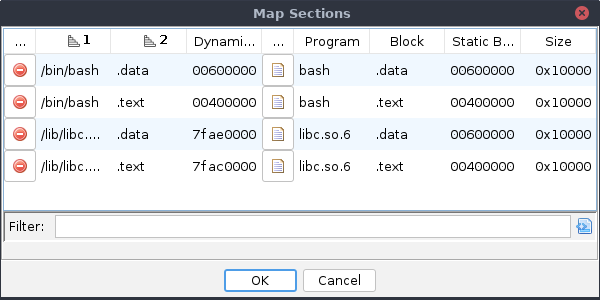
This action is analogous to the Map Modules action. It searches the tool's open programs for blocks matching the selected sections and proposes new mappings. Users who prefer this to Map Modules should also consider setting Auto-Map to use Sections.

This action is available from the pop-up menu, when the current selection indicates a single module and there is an open program. It behaves like Map Sections, except that it will attempt to map sections from the indicated module to blocks in the current program.
This action is available from a single section's pop-up menu, when there is an open program. It behaves like Map Sections, except that it will propose the selected section be mapped to the block containing the cursor in the static listing.
This action is offered to resolve a "missing module" console message. Such a message is reported in the Debug Console when the cursor in the Dynamic Listing cannot be synchronized to the static listing for lack of a module mapping. This action is equivalent to Import From File System on the missing module.
This action is offered to resolve a "missing module" console message. Such a message is reported in the Debug Console when the cursor in the Dynamic Listing cannot be synchronized to the static listing for lack of a module mapping. This action is equivalent to Map Module To on the missing module.
This action is offered to resolve a "missing program" console message. Such a message is reported in the Debug Console when the launcher fails to map the current program database to the launched trace. This action is equivalent to Map Modules, but considering only the missing program and launched trace.
This action is offered to resolve a "missing program" console message. Such a message is reported in the Debug Console when the launcher fails to map the current program database to the launched trace. This action is only available when the current trace is the launched trace. It finds the module containing the cursor in the Dynamic Listing and proposes to map it to the missing program.
This action is offered to resolve a "missing program" console message. Such a message is reported in the Debug Console when the launcher fails to map the current program database to the launched trace. This action is equivalent to Map Identically, but for the missing program and launched trace.
This actions is always available. By default the sections table (bottom) is showing. Some debuggers do not offer section information, and even for those that do, it can be expensive to retrieve it. The visibility of the section table is controlled by toggling this action.
This action is always available. By default the bottom table displays all sections in the current trace. When this toggle is enabled, and at least one module is selected, the bottom table will only include sections contained by a selected module.
This action is available when at least one module or section is selected. It selects all addresses in the Dynamic Listing contained by the selected modules or sections.
This action is available when the Dynamic Listing's cursor is at a valid location. It selects the module and section, if applicable, containing that cursor. If the dynamic listing has a selection, it selects all modules and sections intersecting that selection.