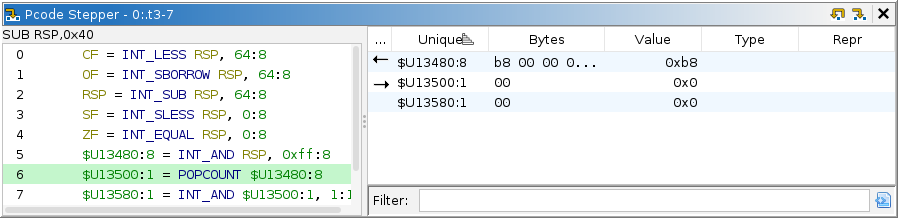
P-code is the "microcode" or "intermediate representation" of Ghidra's processor models, compiled from their Sleigh specifications. Originally designed to facilitate static analysis, it is easily applied to emulation as well. Stepping each p-code operation is an effective means of debugging the Sleigh. The plugin provides two panes: 1) The p-code listing, and 2) Unique or temporary variables. The listing works similarly to the dynamic listing. It displays each p-code operation, highlighting the current "counter", which is the next operation to be executed. There is also a cursor, allowing selection of an operation. The variables view operates similarly to the registers view, displaying the current value of each unique variable.
P-code stepping is built into the emulation framework, and so the other UI elements (listing, registers, etc.) will display machine state from emulated p-code operations, i.e., partially executed machine instructions. The p-code stepper provides a means of navigating time at the p-code-level and displaying p-code-level details of the machine state.
The unique variables table displays information about temporary variables, including their values and user-assigned types. It has the following columns:
The p-code stepper provides the following actions. Regarding other windows' ability to interact with the target, stepping at the p-code level implies you are no longer "at the present."
This action is available when the current coordinates have some positive number of p-code ticks. It steps the trace backward to the previous p-code tick.
This action is available when a thread is selected. It steps the current thread forward to the next p-code tick, using emulation. Note that emulation does not affect the target. Furthermore, emulation of p-code user-ops, including those indicating a system call, is generally not possible. Pluggable mechanisms for emulating user-ops and/or simulating a more complete system is a work in progress.