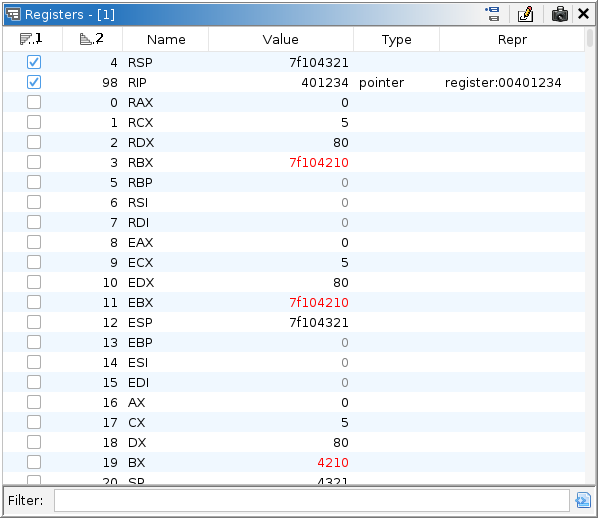

Registers refer to the target processor's register banks. In multi-threaded environments, it is assumed that each thread has its own register context. The register window presents a subset of registers for the current thread understood by both the target and Ghidra's language model for the target processor. It permits for the selection, organization, display, search, modification, and analysis of the registers and values.
The register window uses colors to hint about the state of registers and their values. By default, changed registers are displayed in red, and stale registers are displayed in dark grey. A stale register is one whose current value is not known. The value displayed is the last recorded value or the default value 0. A changed register is one whose value has just changed. For example, if a register is modified as result of stepping, then that register is changed. However, given the possibility of rewinding, changing thread focus, etc., "changed" is actually subtly more flexible. The registers window remembers the user's last coordinates (time, thread, frame, etc.) as well as the current coordinates. So, "changed" more precisely refers to a register whose value differs between those two coordinates. This permits the user to switch focus between different coordinates and quickly identify what is different, so long as those coordinates pertain to the same processor language.
The table displays information about registers, including their values and types. It has the following columns:
The register window provides the following actions:
Right-clicking a registers' value will display a Go-To action for each address space in which the value is a valid offset. Selecting one will navigate the Dynamic Listing to the given address. The action will be disabled if the address is not in the trace's address map, i.e., it is not contained in a region of memory known to the debugger. To prevent this behavior, enable Force Full View.
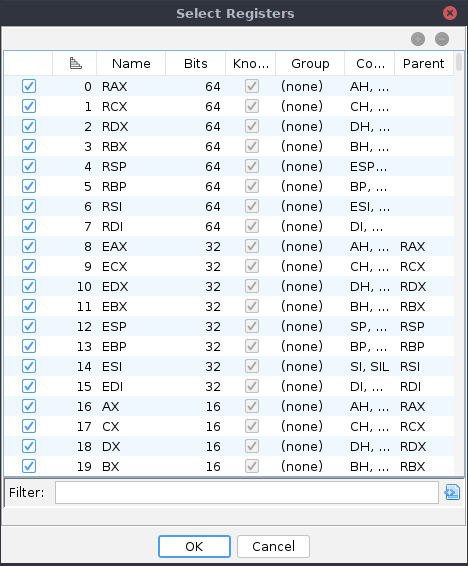
This displays a dialog for selecting which registers to display in the table.

The dialog provides more information about each register, displays a potentially larger set of registers, and permits the selection of registers to include in the window. This is a more persistent and more precise means of removing registers from the window, compared with filtering. Note that deselecting a register does not necessarily prevent that register from being read. Nor does it prohibit other components from reading that register. For example, the program counter and stack pointer are recorded by the target whether or not they're displayed in the table. The actions allow for the addition and subtraction of selections from the register set. Most columns are self-explanatory or duplicate the same column in the main window. The Known column indicates whether Ghidra was able to find the same register on the target. Modifying the values of unknown registers cannot affect the target. Selected registers are memorized per platform.
This action is available on the context menu when there is a single register selected with a data type assigned. It permits the adjustment of that data type's settings, e.g., to display decimal vs hexadecimal. The settings are saved to the trace's data unit for the register.
This toggle is a write protector for machine state. To modify register values, this toggle must be enabled. Edits are directed according the to Control and Machine State Plugin.
This button is analogous to the "snapshot" action of other Ghidra windows. It generates a clone of this window. The clone will no longer follow the current thread, but it will follow the current time.