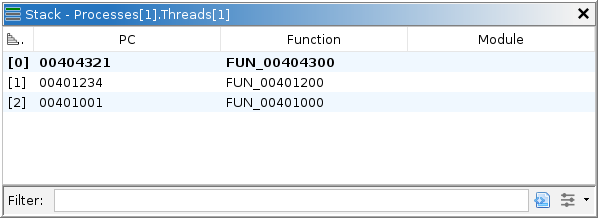
The stack window displays the current trace's execution stack, as unwound and reported by the target. Not all debuggers will unwind the stack, in which case, this window displays only the innermost frame. When emulation is used to generate the current machine state, only a single synthetic frame is shown. See the Unwind Stack action for an alternative mechanism that unwinds using Ghidra's program databases and works during emulation. Level 0 always refers to the innermost frame, and each incremental level refers to the next caller in the chain — most of the time. The current frame comprises one element of the tool's current coordinates. Double-clicking a frame activates new coordinates, potentially causing other windows to display different information. Namely, the Registers window will show registers for the current frame, assuming they can be retrieved. The Listings may also navigate to the current frame's program counter.
The stack table has the following columns:
The stack plugin provides a single action:
This action is in the main menu: Debugger → Analysis → Unwind from frame 0. It attempts to unwind the current thread's stack segment, creating frame data units in the listing. It starts by reading the program counter and stack pointer from the innermost frame of the current thread. It then maps the program counter to the program database and analyzes the function containing it. If successful, it can determine the frame's base address then locate variables, saved registers, and the return address. Knowing the return address and frame depth, it can derive the program counter and stack pointer of the next frame and unwind it in the same manner. This proceeds until analysis fails or the stack segment is exhausted. For best results, ensure you have imported and opened the Ghidra program database for every module, or at least the subset you expect to see in your stack. To view the results, navigate to or follow the stack pointer in a Dynamic Listing. The Stack window does not display Ghidra's unwinding results.
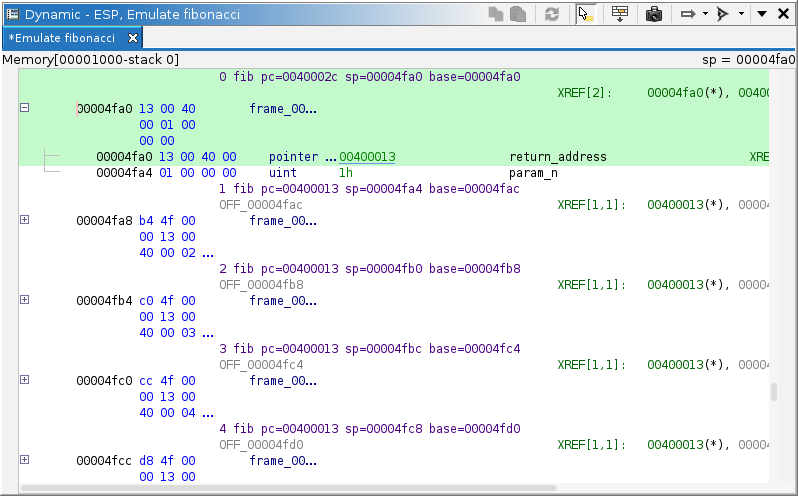
Each call record generates a structure data unit derived from the function's frame. The exact contents of the structure depend on the current program counter within that function. Only those entries actually allocated at the program counter are included. Each field in that structure can be one of five kinds:
local_ prefix. They
correspond exactly to those entries found in the function's stack frame in the program
database.param_ prefix. They
correspond exactly to those entries found in the function's stack frame in the program
database.return_address. It is determined by
interpreting the function's machine code.saved_ prefix. They are
determined by interpreting the function's machine code.offset_ prefix (or
posOff_ for positive offsets). They represent unused or unknown entries.The frame entries are not automatically updated when a function's frame changes in a program database. To update the unwind after changing a function's stack frame, you must unwind again.