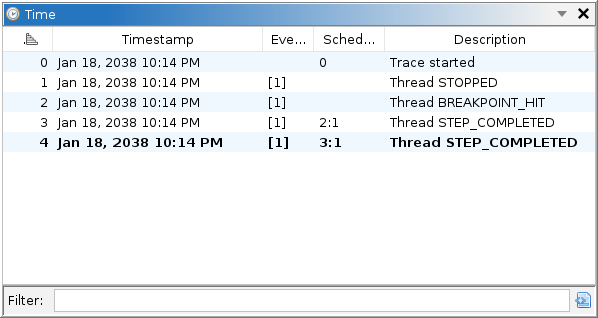
This window displays all recorded snapshots in the current trace. Typically, there is one snapshot per event recorded. Other windows often display the times of various events or use time ranges to describe lifespans of various objects. Those times refer to the snap, which is a 0-up counter of snapshot records. Thus, a snapshot is a collection of observations of a target's state, usually while suspended, along with any mark up. Double-clicking a snapshot activates the selected point in time, i.e., the entire Debugger UI will navigate to the selected snapshot. NOTE: Navigating through time is not permitted while in Control Target mode, unless the back end supports time travel.
The table has the following columns:
This action is available in the menu whenever the focused window has an associated snapshot. It will prompt for a new description for the current snapshot. This is a shortcut to modifying the description in the time table, but can be accessed outside of the time window.
This action is available when a trace is active. It prompts for a time schedule. In
many cases, it is simply the snapshot number, e.g., 3, which will go to the
snapshot with key 3. It may optionally include an emulation schedule. For example,
3:10 will use snapshot 3 for an emulator's initial state and step 10 machine
instructions on snapshot 3's event thread. If the snapshot does not give an event thread, then
the thread must be specified in the expression, e.g., 3:t1-10. That expression
will start at snapshot 3, get the thread with key 1, and step it 10 machine instructions. The
stepping commands can be repeated any number of times, separated by semicolons, to step threads
in a specified sequence. For example, 3:t1-10;t2-5 will do the same as before,
then get thread 2 and step it 5 times.
The emulator's state can also be patched by the schedule. Instead of specifying the number
of steps, write a Sleigh statement, e.g., 3:t1-{r0=0x1234};10. This will
start at snapshot 3, patch thread 1's r0 to 0x1234, then step 10 instructions. As for steps,
the thread key may be omitted for Sleigh commands. Each command without a thread specified
implicitly uses the one from the previous command, or in the case of the first command, the
event thread. Only one Sleigh statement is permitted per command.
A second command sequence may be appended, following a dot, to command the emulator at the
level of p-code operations as well. This is particularly useful when debugging a processor
specification. See the P-code Stepper
window. For example, 3:2.10 will start at snapshot 3 and step the event thread 2
machine instructions then 10 p-code operations. The same thread-by-thread sequencing and state
patching commands are allowed in the p-code command sequence. NOTE: the entire
instruction sequence precedes the entire p-code sequence, i.e., only a single dot is allowed.
Once the schedule enters p-code mode, it cannot re-enter instruction mode.
This toggle action is always available in the toolbar of the Time window. It is disabled by default. The emulation service, which enables trace extrapolation and interpolation, writes emulated state into the trace's scratch space, which comprises all negative snaps. Some time-travel capable back ends may also write into scratch space. When this toggle is enabled, those scratch snapshots are hidden.
These actions are available when a trace is active. It sets the display radix for snapshot keys and time schedules throughout the tool. This is useful to match the display of time coordinates with a back end that supports time travel. Notably, WinDbg TTD uses upper-case hexadecimal for its event sequence numbers. Normally, the back end would set the UI's radix automatically, but in case it does not, or if you'd like to override the radix, these actions are available.