To display or export a graph, Ghidra supports multiple graph services. Ghidra has two
built-in graph services; one to display a graph and one to export a graph. Before invoking
the graph actions described below, make sure to choose the desired graph service. This choice
will direct the output of the graph function to the active graph service. To select a graph
service, use the Graph![]() Graph Output menu.
Graph Output menu.
Program control flow Graphs can be created and then shown using an appropriate graph service. A control flow graph is a representation of the flow from one portion of the code to another. The nodes of the graph represent blocks of code and the edges represent flow between the blocks of code.
There are two basic flow graph types, Block Flow and Call Graph. Different colors and shapes are used to depict each node and the flow between them.
Data graphs show reference relationships between memory locations. They can be constrained to just "To References", just "From References", or both. By default a single hop is graphed with the option to extend from within the graph.
Multiple graphs of any or all types can exist at any time.
A Call Graph depicts subroutines as nodes. Calls between subroutines are shown as edges. Under normal circumstances all nodes are subroutine entry points (orange triangle) and all edges are calls (orange).
A Block Flow graph is a little more complicated. Each node is a contiguous set of instructions or Code Block broken by an instruction that causes any type of flow. Move and arithmetic instructions cause no change in flow so they will not break a block. Jump, Call, and return instructions cause flow and will lie at the end of a Code Block. Block Flow graphs are useful for looking at the control flow within a function in compiled code. For embedded systems that have convoluted control flow structure, it may be beneficial to graph the entire program.
When creating any of the graphs described below, the scope of the graph is determined by the current location and selection present in the listing.
If there is a selection:
The graph will include all the code that is selected and exclude all the code that is not selected.
If there is no selection:
The scope is determined by the current cursor location and the type of graph:
Current Location is in a Function
- Block Flow Graphs: The scope is the body of the containing functions
- Call Graphs: The scope is the containing function and all the functions that either call it or it calls
Current Location is not in a Function
- the scope will be the entire program
To graph the entire program, press "<ctrl> a" to select all before creating the graph.
Selection and Location events are synchronized between each graph and the other windows in the tool.
Selection
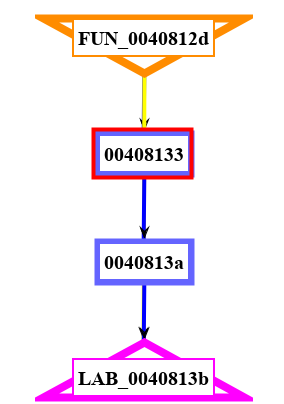
The current selection within the graph display is represented by a red box around selected nodes as shown below on the node labeled "00408133". A node is selected if any addresses it represents are contained within the selection.
When a selection is made in the graph display, all addresses represented by each selected node become the new current selection within Ghidra.
See the documentation for the specific graph display for descriptions of how to to make selections and navigate the graph.
Location
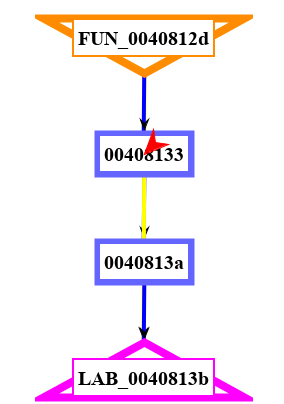
The node containing the current address location is marked with a large red arrow as shown below on the graph node labeled "00408133".
Whenever the cursor location changes in the Code Browser (or tool that created the graph), the red arrow location on the graph is updated. The current location is also changed when a selection of nodes is made within the graph display. The minimum address of all nodes within the selection will become the current location. If the address of the current location is not part of any node within the graph, the red arrow will not be visible.
When the option Graph
Show Location is turned on, the graph will re-orient itself to insure that the red location arrow is always visible.
Clicking on a node in the graph display causes the current address location within Ghidra to change to the minimum address represented by the graph node.
By Default, the graphs use the following icons and colors to represent the nodes and edges.
|
Graph Edge/Link Types |
|
| Edge Type | Color |
| Fall-Through Flow | Blue |
| Unconditional Jump | Green |
| Conditional Jump | Yellow |
| Unconditional Call | Orange |
| Conditional Call | Orange |
| Computed Call or Jump | Cyan |
| Indirect (i.e., pointer) | Pink |
| From Entry Nexus | White |
|
Graph Node/Vertex Types |
||
| Vertex Type | Color | Shape |
| Entry | Orange | Triangle (down) |
| Body | Blue | Oval |
| Terminator | Purple | Triangle (up) |
| Switch | Cyan | Diamond |
| Bad | Red | Rectangle |
| Data | Pink | Cylinder |
| Entry Nexus | White | Cone |
When Reuse Graph is turned on, creating any new graphs will re-use the active graph window. The active graph is the last graph window that was focused. This could be the last graph window created, popped to the top, or interacted with to change the current selection or location. Instead of a new window for each graph, all graphs will be rendered using the same window. When a graph window is re-used the existing graph information is cleared and replaced with the new graph information. If Append Graph is also turned on, the information is also appended to the active graph window.
To Reuse A Graph,
- Turn on Reuse Graph
(a check mark will display next to the menu item)- Select an existing graph window to set it to the active window.
(this will pop the graph window to the front)- Create a graph using:
Select Graph
When Append Graph is turned on, creating any new graphs will append the graph information to the active graph. The active graph is the last graph window that was focused. This could be the last graph window created, popped to the top, or interacted with to change the current selection or location.
To append to an existing graph,
- Turn on Append Graph
(a check mark will display next to the menu item)- Select the Graph window to append to
(this will pop the graph window to the front).- Create a graph using:
Select Graph
When Show Location is turned on, the current address location will be forced to visibly display within all graph windows. This may cause the graph to change its view scale; resulting in disorientation when looking at a graph that has been carefully arranged (clinically know as graphidisorientitis).
When Show Location is turned off, the graph view will not change as the current address location changes.
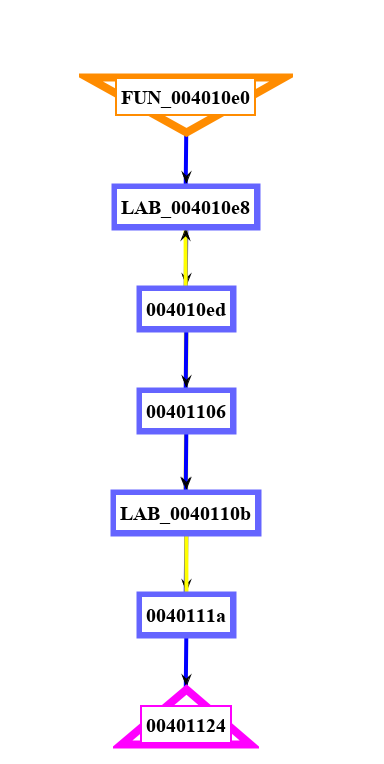
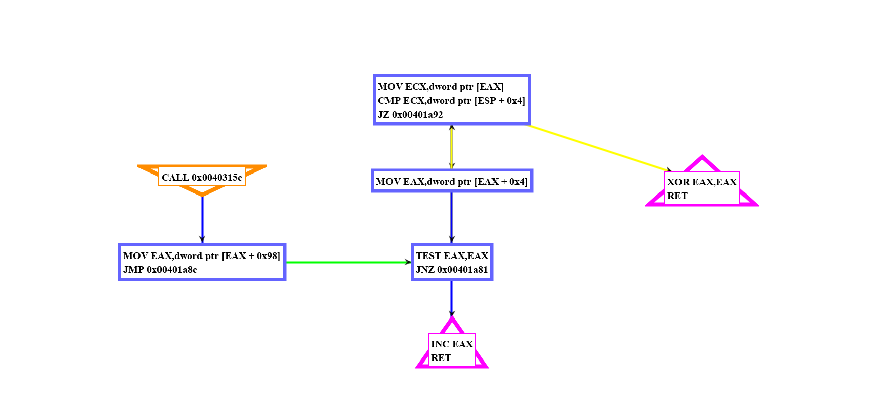
A Block Flow Graph consists of nodes that represent Basic blocks of contiguous instructions. Basic blocks are broken up by any instruction that causes a change in execution flow. All Jump, Call, Branch, and Return instructions can cause the execution flow to change. Arithmetic and store/load instructions do not break a Basic block because they do not change the execution flow. A labeled instruction will always start a block regardless of the instruction type.
For example:
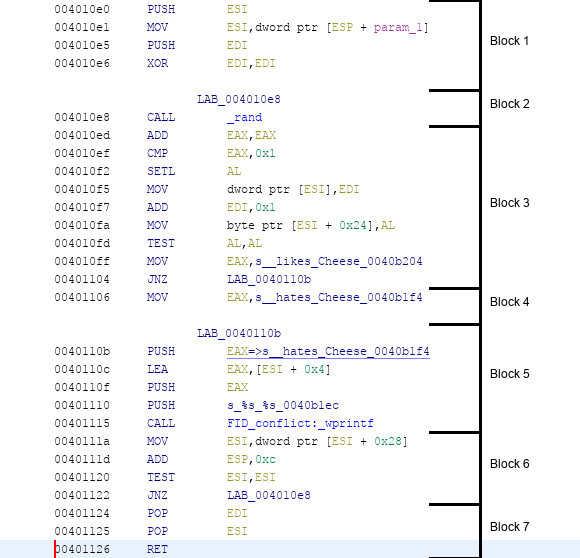
Would generate the following graph:
To Graph Block Flow Using the default model,
Rename Symbol
Allows the user to rename the symbol in the program represented by the given vertex.
A Code Flow Graph is an extension of a Block Flow Graph in which each graph node (i.e., vertex) contains the list of instructions contained within the associated block. The list of instructions are passed to the graph as the vertex label.
A graph of the call instruction flow from one subroutine to another can be created with
Graph![]() Calls. The graph is created using the default
Call Model. Several Subroutine Models are available. Each model provides a slightly
different perspective on what constitutes a subroutine.
Calls. The graph is created using the default
Call Model. Several Subroutine Models are available. Each model provides a slightly
different perspective on what constitutes a subroutine.
To Graph Calls Using the default model,
- Select Graph
- A new graph window is created
To Graph Calls Using a specific model*,
- Select Graph
- Select one of
- Isolated Entry Model
- Multiple Entry Model
- Overlapped Code Model
- Partitioned Code Model
- A new graph window is created
A graph of data references can be created with Graph![]() Data then selecting To References, From References or To/From References.
Only the selected references will be included. By default only a single layer of references will
be graphed, this can be adjusted using the Edit
Data then selecting To References, From References or To/From References.
Only the selected references will be included. By default only a single layer of references will
be graphed, this can be adjusted using the Edit ![]() Tool Options
Tool Options ![]() Graph
Graph ![]() Max Reference Depth
Max Reference Depth
To graph Data References,
- Select the data to start from in the listing
- Select Graph
- Select one of
- To References - selected data and all references to it
- From References - selected data all references from it
- To/From References - selected data and all references to and from it
- A new graph window is created with the selected data and the specified references. By default this includes one layer of references but this may be adjusted in the options as specified above, or dynamically using the Add References action on the desired node
Add References
Allows the user to add references starting from the selected nodes, with To References, From References or Bidirectional as selected.
These are the display options for graphs that are types of "Program Graphs" such as Call graphs, Block graphs, etc. These types of graphs use program elements as vertices and reference types as edges. See Graph Type Display Options for general help on graph type display options.
Provided by: Program Graph Plugin