Visualizing PREFETCH Infoleaks to Defeat KASLR
Recently I decided to dust down my Windows kernel skills and look into recent exploits and mitigations. As it's usual in my praxis, my timing was "perfect": Windows 11 24H2 killed classic KASLR leaks.
The only generic technique I could find publicly documented was EntryBleed a side-channel technique that was successfully applied by @carrot_c4k3 to Windows.
As you'll see in the first subsection, I gave the public PoC a shot, and while it didn't work at all, I felt like I could make it work, even though I have zero experience with CPU side-channel attacks.
Given the above limitations, this post will most certainly not reveal the Next Big Infoleak™, but hopefully will demonstrate how seemingly esoteric problems, like extracting accurate information from hardware "noise" can be solved with dumb algorithms that don't even require boiling away the oceans.
prefetch-tool
prefetch-tool is @carrot_c4k3's experimental code to leak the kernel base address on Windows. The basic idea is explained in her blog post:
Prefetch takes an address and attempts to load the content of it into the CPU’s cache so that future accesses will be faster. Unlike instructions that read or write to a given address, prefetch does not care if the address provided is a kernel address. It turns out that by measuring the amount of time a prefetch instruction takes to execute given a target address, it is possible to determine if the target address is in the current page tables.
Update(2025.06.16.): This writeup by r0keb goes deeper into theory and implementation details.
When I executed this tool (modifying it a bit to not complain about the unknown CPU) on a Windows 11 VM running in QEMU-KVM it simply crashed. The reason for this was easy to see in a user-mode debugger: the rdtscp instruction is disabled by default by the hypervisor so we can't use this instruction to retrieve timing data. As I didn't wish to recursively fall into rabbit holes I simply switched to host CPU passthrough. In this configuration the program no longer crashed.
Unfortunately the infoleak wasn't successful either. After consulting the Intel-specific parts of the source code I found that prefetch-tool uses a single-pass scan
and a threshold value to identify the first prefetch result that is fast enough - the address corresponding to this fast access will be reported as the kernel base.
A nice feature of prefetch-tool is that it can report the raw collected data for manual investigation when we use the -pt command line flag. So I started eyeballing patterns in the output...
Statistics and Visuals
A side-channel is like violence: if it doesn't work, you don't use enough of it.
Of course in this test setup I knew the base address of the target kernel, so it was easy to see that times get wacky when we hit the appropriate address:
fffff802e3100000 73
fffff802e3200000 73
fffff802e3300000 73
fffff802e3400000 73
fffff802e3500000 73
fffff802e3600000 73
fffff802e3700000 250
fffff802e3800000 73
fffff802e3900000 73
fffff802e3a00000 73
fffff802e3b00000 73
fffff802e3c00000 63
fffff802e3d00000 136
fffff802e3e00000 59
fffff802e3f00000 58
fffff802e4000000 60
fffff802e4100000 59
fffff802e4200000 153
fffff802e4300000 119
fffff802e4400000 128
In the above listing the value 73 seems common, and while there are positive deviations from this value, the measured delay drops at fffff802e3c00000, then produces continuing deviations from the common timing. This address happens to be the kernel base.
Based on pure empirical observation my hypothesis at this point was that:
- the value 73(+/-1) is the result of a relatively quick bail-out in case of unmapped addresses
- Kernel pages will show some deviations either because contents are already in the cache (negative deviation) or need to be loaded (positive deviation)
- Not only negative deviations are important
- Consecutive deviations from the common value likely correlate with the length of the corresponding module
Problem is, even in such a small sample it's obvious that deviations don't only occur in case of kernel addresses. It would be nice if we could extract some patterns from this data!
The human brain is pretty good at pattern recognition[citation needed], just not necessarily when presented with lists of numbers. Previously I spent considerable time on detecting memory disclosures based on Chris Evans' great blog post, titled "What Does a Pointer Look Like Anyway?". I remember that visually spotting "interesting" data on images is much easier than writing an algorithm for the same task, but once you see what you are looking for, creating automation also becomes easier.
My next step was to squeeze an image generator into prefetch-tool - I contemplated using Python on the text output, but I wanted to keep the code portable so I can test it on multiple computers without dependencies. Fortunately a BMP can be built from raw pixel data and a simple, ~50 bytes long header. Some 80 LoC later I got my first image of the retrieved timings:

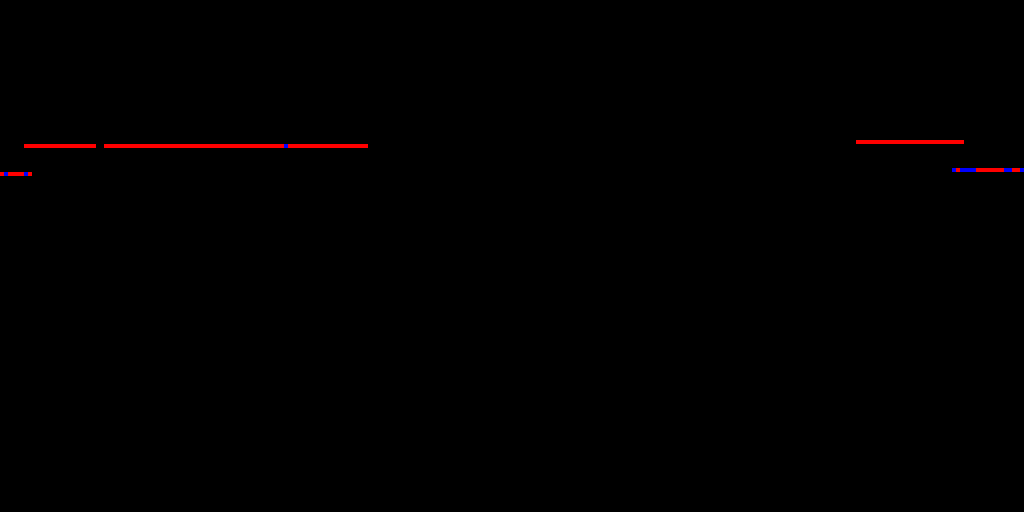
Red and blue pixels indicate positive and negative deviations from the most common value. The image is scaled up, the zeroth address is in the bottom left corner (needs vertical flipping for top-down "reading"). Those horizontal lines look interesting! What if we run the data collection multiple times from the same process:
The lines look pretty static! If we take a look at the actual addresses, we find the following:
- The slightly fainter leftmost line is actually unmapped
- The middle line is the kernel
- The long, bottom-right line is
win32k
This simple visualization already provides us with some important insights:
- Continuous lengths of lines (I call these "strips") indeed correlate with the size of the corresponding module
- Negative deviations are rare and seem to only occur in groups along kernel addresses
- The gap between
win32kand the kernel seems to be constant (I didn't experiment with this further)
The next step is to get rid of all that noise and identify the correct one from the remaining strips. For this, I implemented the following algorithm:
- Execute data collection multiple times (5 works), for each iteration
- Identify the most common value
- Identify strips of uncommon values (of at least N length)
- Accumulate all uncommon strip values in a new clean map, containing the (added) data of strips only
In short we add strip values while ignore dots in a new map. This results in a clean map similar to the following, with bright peaks on a largely black area (different boot, flipped, I promise the post continues after the black background):
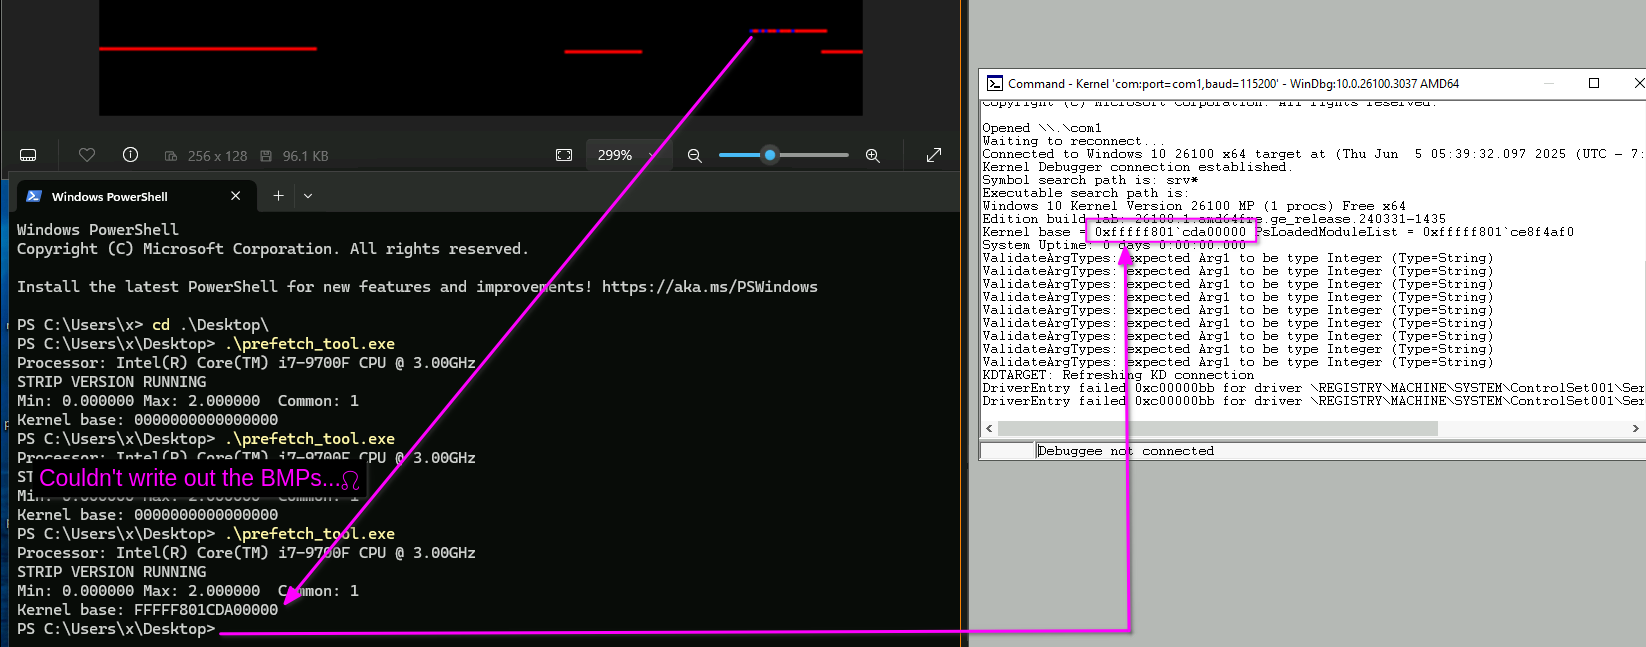
The final step of the algorithm is:
- Find the strip in the clean map that is at least K long (tuned based on the target kernel image) and contains a group of at least D deviations (3 works fine)
With this I can leak the kernel base on my test system:
Reliability
Would you base your million dollar cyber weapon on this?

Probably not. While I got pretty consistent results, one thing I observed during experimenting is that deviations frequently occur right before the true base address - if this noise grows above a threshold, it'll definitely mess up your gadget chain (but again, you can try more iterations). Not to mention, I could only test this on a couple of different machines (thx Pepe&Geri!):
- Intel i5 G11 and i7 G9 worked
- Xeon E5 v4 did not work - No fast accesses were detected, slight positive deviations resulted in a single large stripe
... your results may vary.
I'd love to hear about your results and ideas for improvement - we could even compile a little gallery of time maps from different systems! The (incredibly messy) code is on my GitHub.
Update (2025.06.16.): The code is now available as a static library with a sample exploit:
PSA: I'm open for work. If this kind of research (or other stuff I do) is interesting to you, feel free to reach out!