Remote Targets
This is the first module of the Advanced part of this course. It assumes you have completed the Beginner portion. At the very least, you should complete Getting Started and A Tour of the Debugger UI first.
Module Mapping Caveats
Beware! Many of the conveniences in Ghidra assume that the target is running from the same file system as Ghidra, which will not be the case when the target is remote. Be sure your current project is populated only with programs imported from the target’s file system. Additionally, if prompted to import something new, be sure to redirect to the remote file system, because the dialog will default to the path on the local file system.
Variation in Configuration
There are a number of configurations for remote debugging with many moving parts. Some of those parts are contributed by Ghidra’s Debugger, some are not. Depending on your particular target and platform, there may be several options available to you. Consider a remote Linux target in user space. While this list is not exhaustive, some options are:
- Use
gdbserverover SSH - Use Trace RMI over SSH
- Use
gdbserverand connect to it manually - Connect Trace RMI manually
Generally, for each of these options it boils down to which components will be colocated with the target and which will be colocated with Ghidra.
Using gdbserver over SSH
In this configuration, Ghidra and GDB will be located in the user’s
local environment, while gdbserver and the specimen will be
located in the target environment. We will connect the local
gdb to the remote gdbserver by forwarding
stdio over SSH.
First, prepare the target, which for demonstration purposes has the IP address 10.0.0.1. Generally, this just means booting it up and ensuring it has
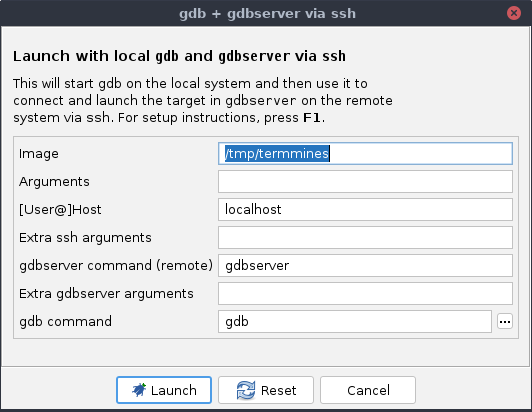
gdbserverinstalled. NOTE: You do not need to rungdbserveror the target binary. The launcher will do that for you.From the launch menu, select gdb + gdbserver via ssh.

Read the wall of text, at least the first time, and verify the remote system is prepared.
Fill out the options appropriately. Notably, correct the location of the target image to point at its location on the target system. Enter “user@10.0.0.1” for the [User@]Host option, substituting your username for the remote system.
Click Launch.
At this point, most things will work the same as they would for a local target.
Using Trace RMI over SSH
In this configuration, Ghidra will be located in the user’ls local
environment, while gdb and the specimen will be located in
the target environment. Notice that we are not using
gdbserver. We will connect the local Ghidra to the remote
gdb by forwarding Trace RMI over SSH. See the help (press
F1 on the gdb via ssh
menu item for advantages and disadvantages of using this
vs. gdbserver.)
First, prepare the target. This is more involved than using
gdbserver, since you will need to ensuregdband the Trace RMI plugin for it are installed. The packages, which should be included with Ghidra, areghidratraceandghidragdb, but you may need to build them first. If you installedgdbandpython3from your distribution’s repositories, installation of the Python packages should be straightfoward. Search the Ghidra installation for files ending in.whl. If theghidratraceandghidragdbpackages are there, you can skip this build step and just transfer them to the target. On the local system:python3 -m pip install build # unless you already have it cd /path/to/ghidra/Ghidra/Debug/Debugger-rmi-trace/pypkg python3 -m buildThis will output
.tar.gzand.whlfiles underpypkg/dist. Do the same forDebugger-agent-gdb/pypkg. Transfer the resulting.whlfiles to the target, then on the target system:python3 -m pip install /path/to/ghidratrace-[version].whl /path/to/ghidragdb-[version].whlIf you are offline, the dependencies are included in the
pypkg/distdirectory for each module. Transfer and install them, too. You may trypython -m pip install --no-index -f /path/to/packages ghidragdb, if all the packages and dependencies are in the one directory. Chances are, GDB embeds the same Python, so they become importable from GDB. Test usinggdbon the target system:python import ghidragdbNo news is good news! You can quit GDB, since that was just for verifying the installation.
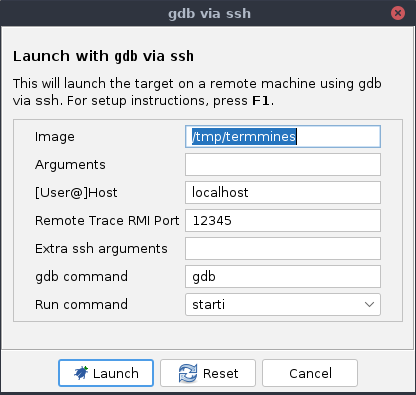
From the launch menu, select gdb via ssh.

Fill out the options appropriately. Notably, correct the location of the target image to point at its location on the target system. Enter “user@10.0.0.1” for the [User@]Host option, substituting your username for the remote system.
Click Launch.
At this point, most things will work the same as they would for a local target.
Troubleshooting
I can’t find the Python packages to install
You may need to build them using the instructions above. The
dependencies are included in the Ghidra installation, but perhaps
something has gone missing. Search for files ending in .whl
or .tar.gz; they should be located in
pypkg/dist in various modules. If you are able to do local
debugging with Ghidra and gdb, then the source is
definitely present and functioning. To (re-)build the packages from
source:
python3 -m pip install build
cd /path/to/ghidra/Ghidra/Debug/Debugger-rmi-trace/pypkg
python3 -m build
This should output a .tar.gz and a .whl
file under pypkg/dist. Send the .whl over to
the target system and pip install it. Do the same for
Debugger-agent-gdb. If that doesn’t work, then in the worst case, copy
the Python source over and add it to your PYTHONPATH.
The python import ghidragdb command fails
Double-check that you have installed all the required packages and
their dependencies. A common forgotten or incorrectly-versioned
dependency is protobuf. We developed using
protobuf==3.20.3. Its “sdist” package is distributed with
Ghidra under Debugger-rmi-trace/pypkg/dist for your
convenience.
It is also possible that gdb has embedded a different
version of the interpreter than the one that python3
provides. This can happen if you built GDB or Python yourself, or you
installed them from a non-standard repository. Check the actual path of
the Python library used by gdb:
ldd $(which gdb)Or, inside gdb:
(gdb) python-interactive
>>> import sys
>>> sys.version
Suppose this identifies version 3.9. Retry the installation commands
using python3.9 -m pip .... If you have multiple copies of
the same version in different locations, you may need to invoke
python3 using its complete path.
In the worst case, copy the Python source over and add it to your
PYTHONPATH.
Using gdbserver manually
The configuration and result here are similar using
gdbserver over SSH, but will be performed manually.
First, prepare the target. This time, you will need to start
gdbserveron the remote system manually. For demonstration, we will listen on 10.0.0.1 port 12345:gdbserver 10.0.0.1:12345 termminesFrom the launch menu, select remote gdb.
Fill out the options appropriately. Notably, enter “10.0.0.1” for the Host option, and “12345” for the Port option.
Click Launch.
At this point, most things will work the same as they would for a local target.
Connecting Trace RMI manually
The configuration and result here are similar to using Trace RMI over SSH, but will be performed manually.
First, prepare the target. Follow the same installation steps as above for Trace RMI over SSH, if you have not already.
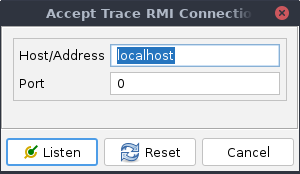
In Ghidra’s Connections window, click Accept a single inbound TCP connection in the local toolbar.

Set Host/Address to “10.0.0.1”, so that we can connect to it over the network. NOTE: You may leave the port as “0” or pick a specific port, assuming you have permission to use it.
Click Listen, and then take note of the acceptor’s port number in the Connections window, e.g., “12345.”
Now, on the remote system, start
gdband type:python import ghidragdb file termmines # set args, if you'd like ghidra trace connect 10.0.0.1:12345 ghidra trace start ghidra trace sync-enable starti
At this point, most things will work the same as they would for a local target. You may notice Ghidra has not given you a new terminal. Just use the one you already have on the remote target.
A notable advantage of this configuration is that you can enter
whatever gdb commands you want to start your target. Here
we demonstrated the simplest case of a “native” target. It is also
possible to use this procedure to connect Ghidra into a running
gdb session.
Rube Goldberg Configurations
While you should always prefer the simpler configuration, it is
possible to combine components to meet a variety of needs. For example,
to debug a native Android target from Windows, you could run Ghidra on
Windows, connect it to GDB via SSH to a Linux virtual machine, e.g.,
WSL2, and then connect that to gdbserver running in an
Android emulator.
Exercise: Debug your Friend’s termmines
If you are in a classroom setting, pair up. Otherwise, play both
roles, preferably using separate machines for Ghidra and the target.
Using one of the above procedures, debug termmines. One of
you should prepare the target environment. The other should connect to
it and launch the specimen. Then trade roles, choose a different
procedure, and do it again.